.svg)
.svg)
The Circular Shift in Plastic: Why the Bottleneck Is Upstream

[.green-heading]Key Takeaways[.green-heading]
- Plastic is a ~475 Mt market that continues to grow structurally, worth ~€630bn in 2025 and potentially more than €1tn by 2035. Its climate footprint is equally large: ~1.8 Gt CO₂e per year, twice that of global aviation, with over 90% sitting upstream in production, not disposal.
- Regulation (EU PPWR, plastic levies) and corporate commitments have converted recycled content from a sustainability ambition into a compliance requirement, creating bankable, policy-backed demand on track to exceed current supply capacity before 2030.
- Mature recycling technologies exist but face structural limits, and newer pathways are still scaling; no single one wins across all dimensions. The binding constraint sits elsewhere: in feedstock, the input that feeds the entire system. Most plastic waste never reaches recycling-grade specification.
- Structural advantage increasingly accrues upstream, in collecting, sorting, and pre-processing, where the rate-limiting bottleneck for every pathway sits.
- We believe the most attractive opportunities emerge where feedstock control, technology readiness, and unit economics converge.
[.green-box]Section 01[.green-box]
A Market Too Large to Ignore, Too Polluting to Leave Unchanged
Plastic is not going away. Global production has roughly doubled since 2000, to approximately 475 million tonnes per year in 2025 [1], and demand is projected to grow at a 2–3% compound annual rate through 2040. Its versatility explains its persistence: plastic is embedded in nearly every artefact of daily life: packaging, textiles, vehicles, buildings, electronics, medical equipment. The drivers of continued growth are structural rather than cyclical: rapid middle-class expansion across Asia and Africa, rising polymer demand from the energy transition itself (electric vehicles, solar infrastructure, grid components), and the persistent absence of scalable, cost-competitive substitutes. Any credible decarbonisation strategy for plastic must therefore work with volume growth, not against it.
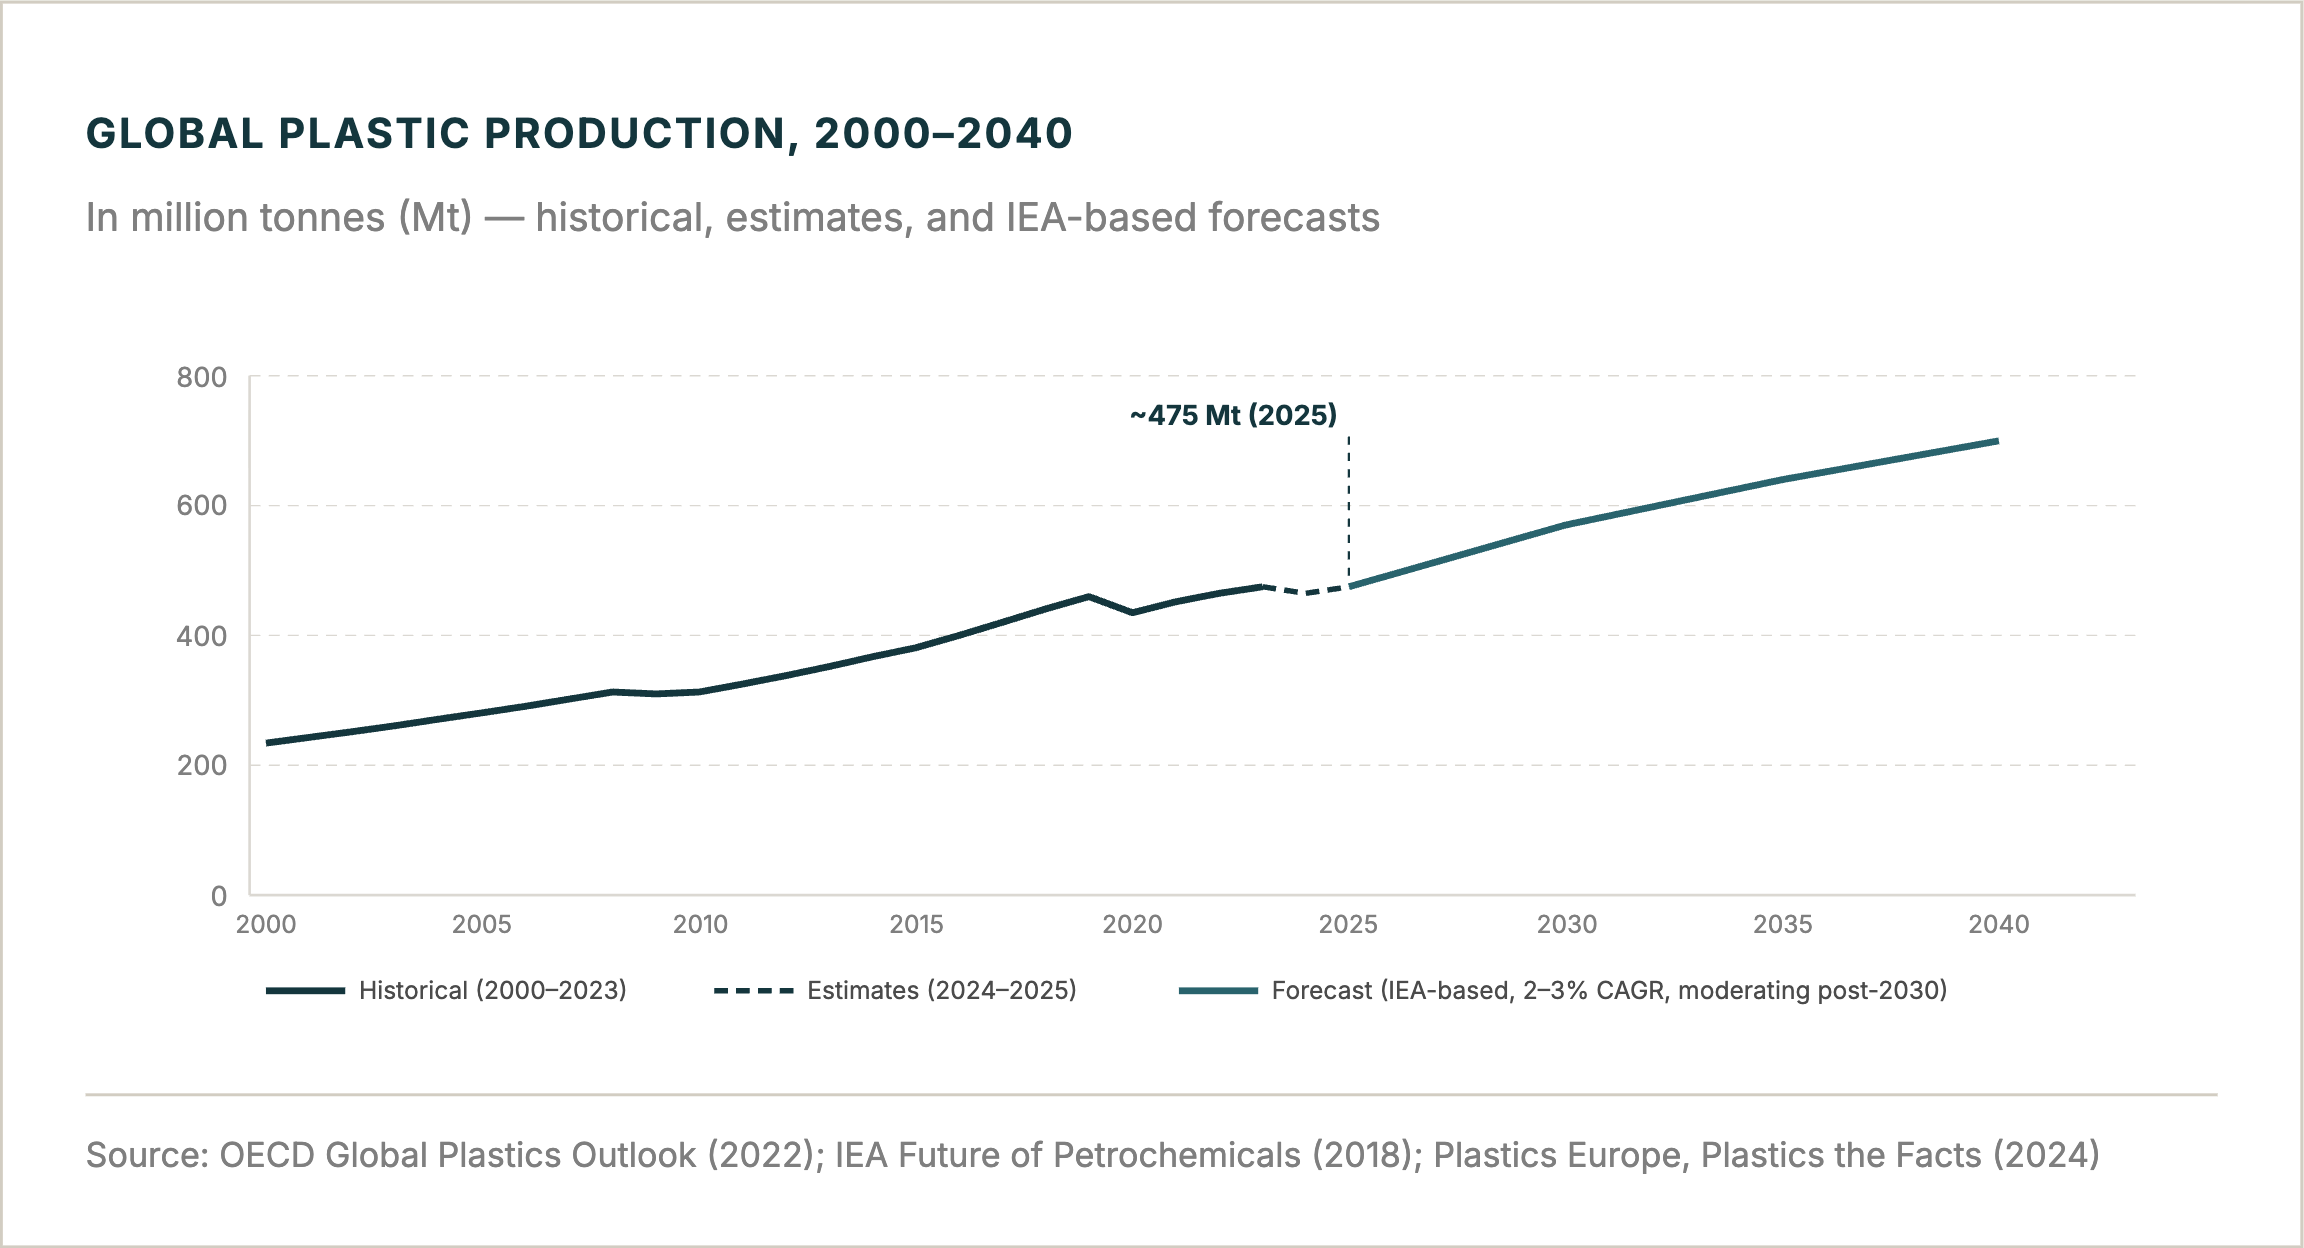
The market behind those volumes is valued at approximately €630 billion in 2025 [2] and could exceed €1 trillion by 2035 on its current trajectory, driven by pricing, a product-mix shift toward higher-performance polymers, and structural volume growth. Its resilience is well documented: the 2008 financial crisis, the 2015 oil price collapse, and the 2020 pandemic each interrupted growth, and each time the market rebounded within one to two years.
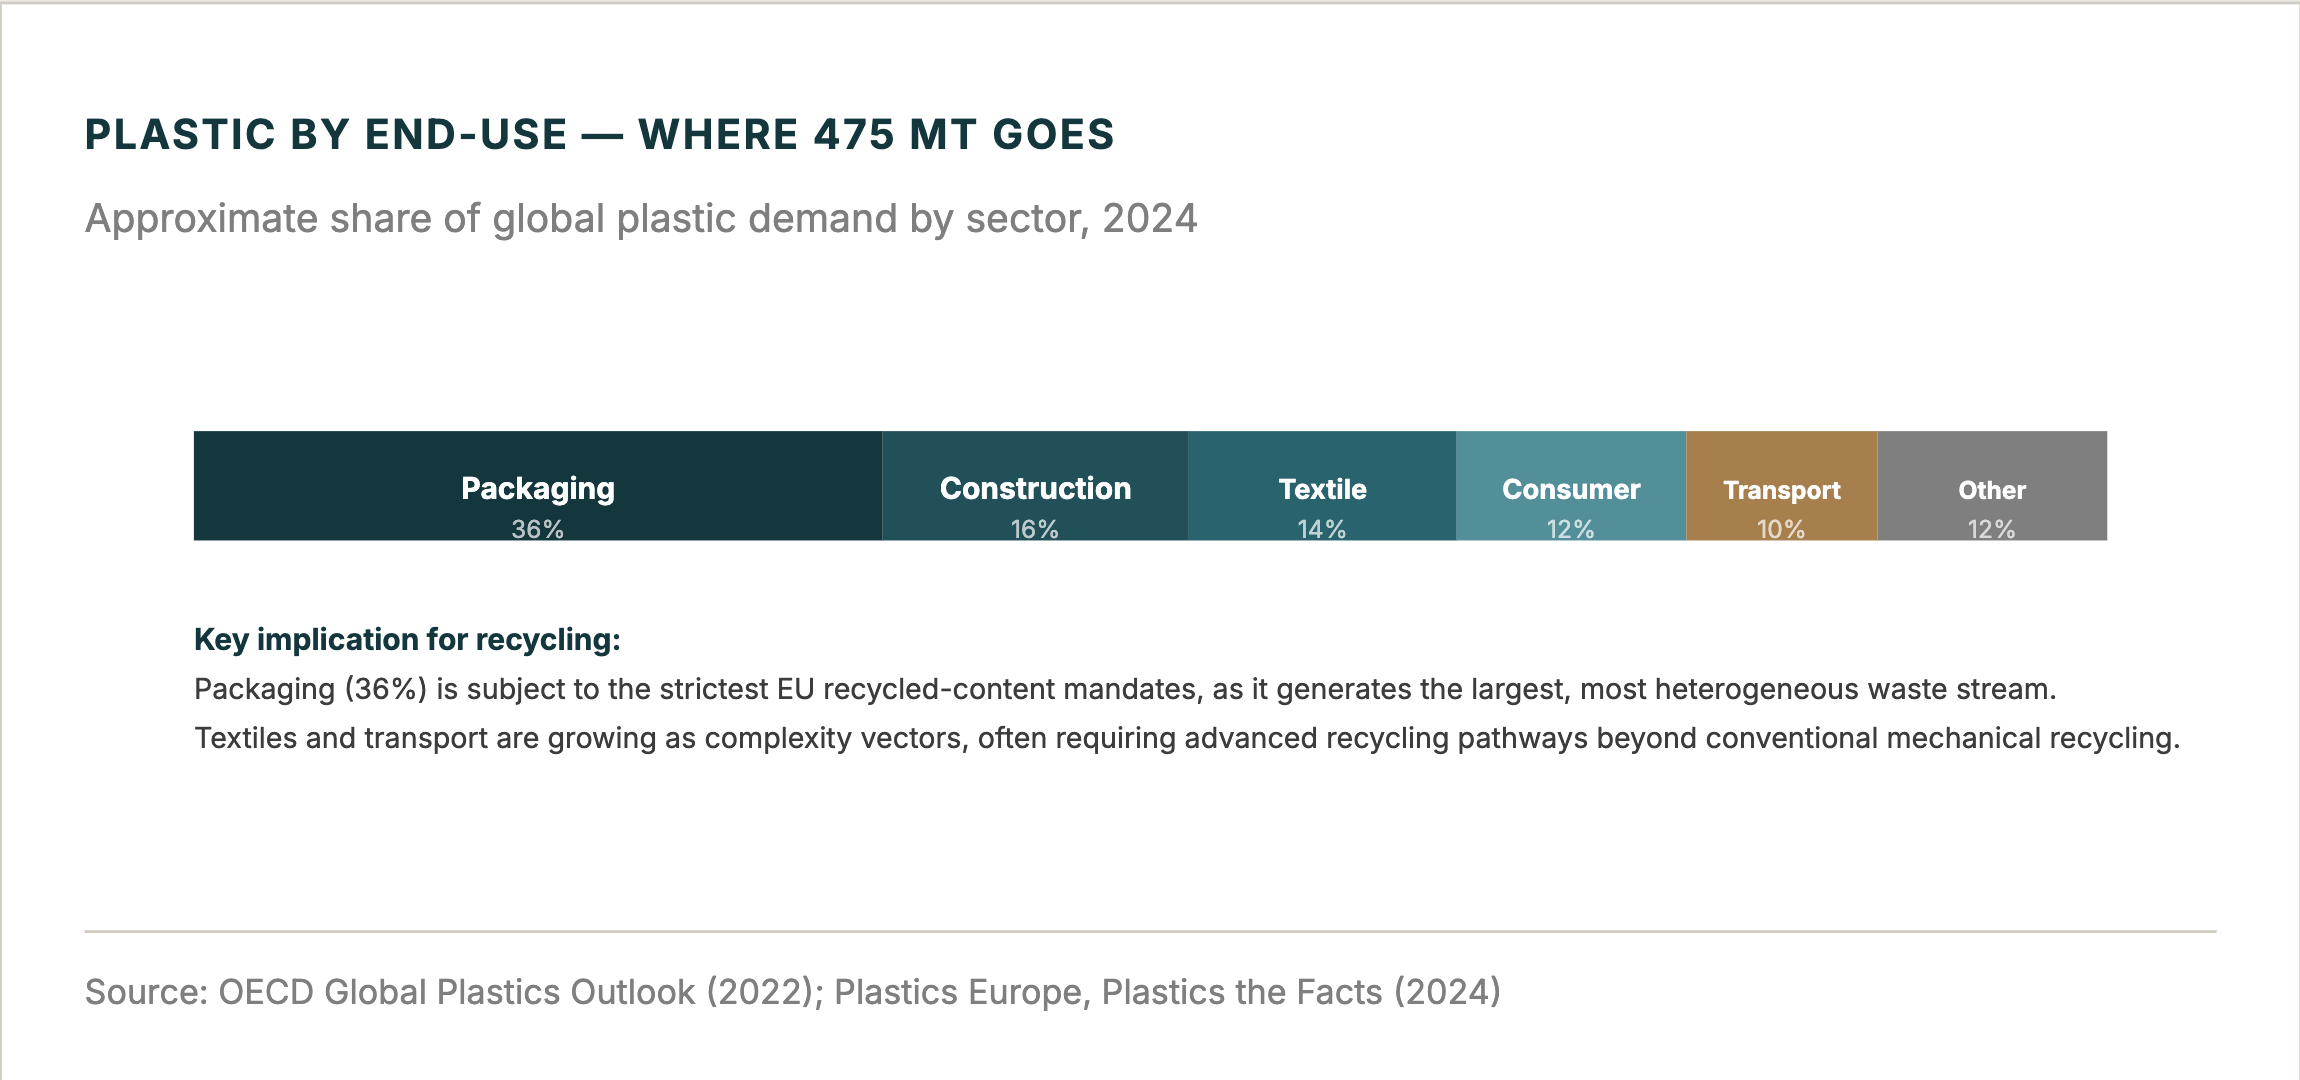
A concentrated set of polymer families underpins this market. Polyolefins, polyethylene (PE) and polypropylene (PP), alone account for roughly 50% of global demand. These are the commodity workhorses: cheap, versatile, and produced at massive scale. With PET (bottles and films), PVC, and polystyrene, the top polymer families represent approximately 80% of global volumes. That concentration matters directly for recycling: it determines which waste streams are large and homogeneous enough to justify industrial infrastructure.
The environmental profile is equally structural. The plastics lifecycle generates approximately 1.8 gigatonnes of CO₂ equivalent per year [3], roughly 3.4% of global emissions, and twice the footprint of global aviation. Critically, approximately 90% of that footprint is concentrated upstream [4]: in fossil feedstock extraction, steam cracking, and polymer manufacturing. End-of-life disposal (landfill, incineration, recycling) accounts for only the remaining 10%.
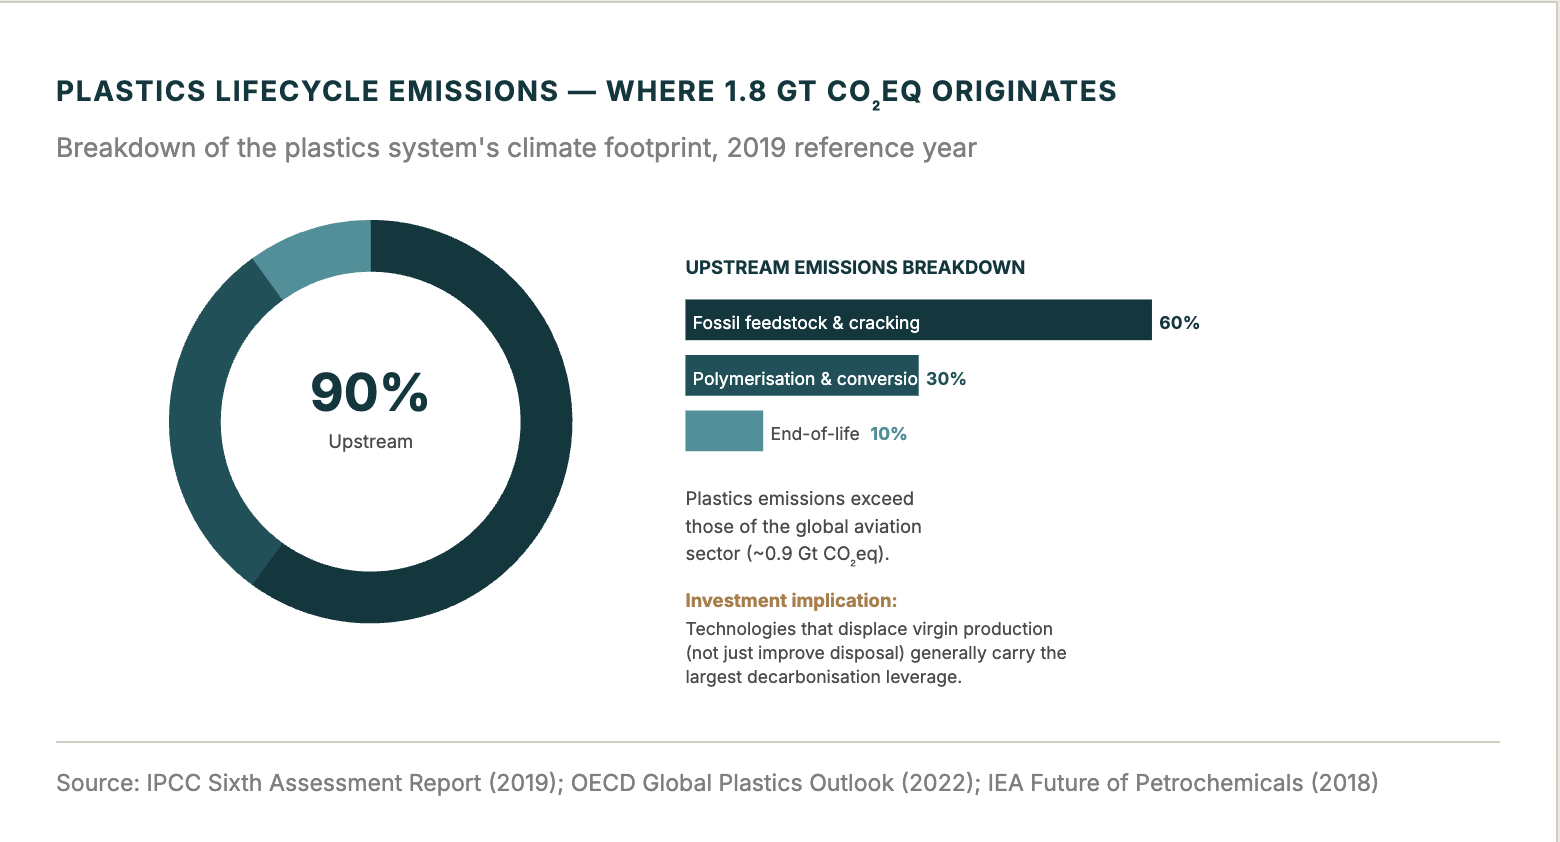
This distribution carries a precise implication for investors. Technologies that displace virgin polymer production, substituting recycled resin for fossil-derived feedstock, are generally positioned to influence a larger share of lifecycle emissions than those focused on end-of-life management. The two aims are not mutually exclusive, but the distinction largely determines where decarbonisation leverage, and therefore strategic value, concentrates.
[.green-box]Section 02[.green-box]
Regulatory Pull and Corporate Demand: A Structurally Imbalanced Market
The most consequential market signal of the past five years is not a technology breakthrough. It is a regulatory one. Europe has moved decisively to embed recycled content into the legal fabric of commerce, and in doing so has created a demand signal that is visible, contractually anchored, and set to grow faster than supply can respond. Europe leads, but it is not alone: California has legislated recycled-content thresholds, the United Kingdom taxes low-recycled packaging, China restricts waste imports and sets binding recycling targets, and Korea and Japan are tightening producer-responsibility and packaging rules. The instruments differ; the direction does not.
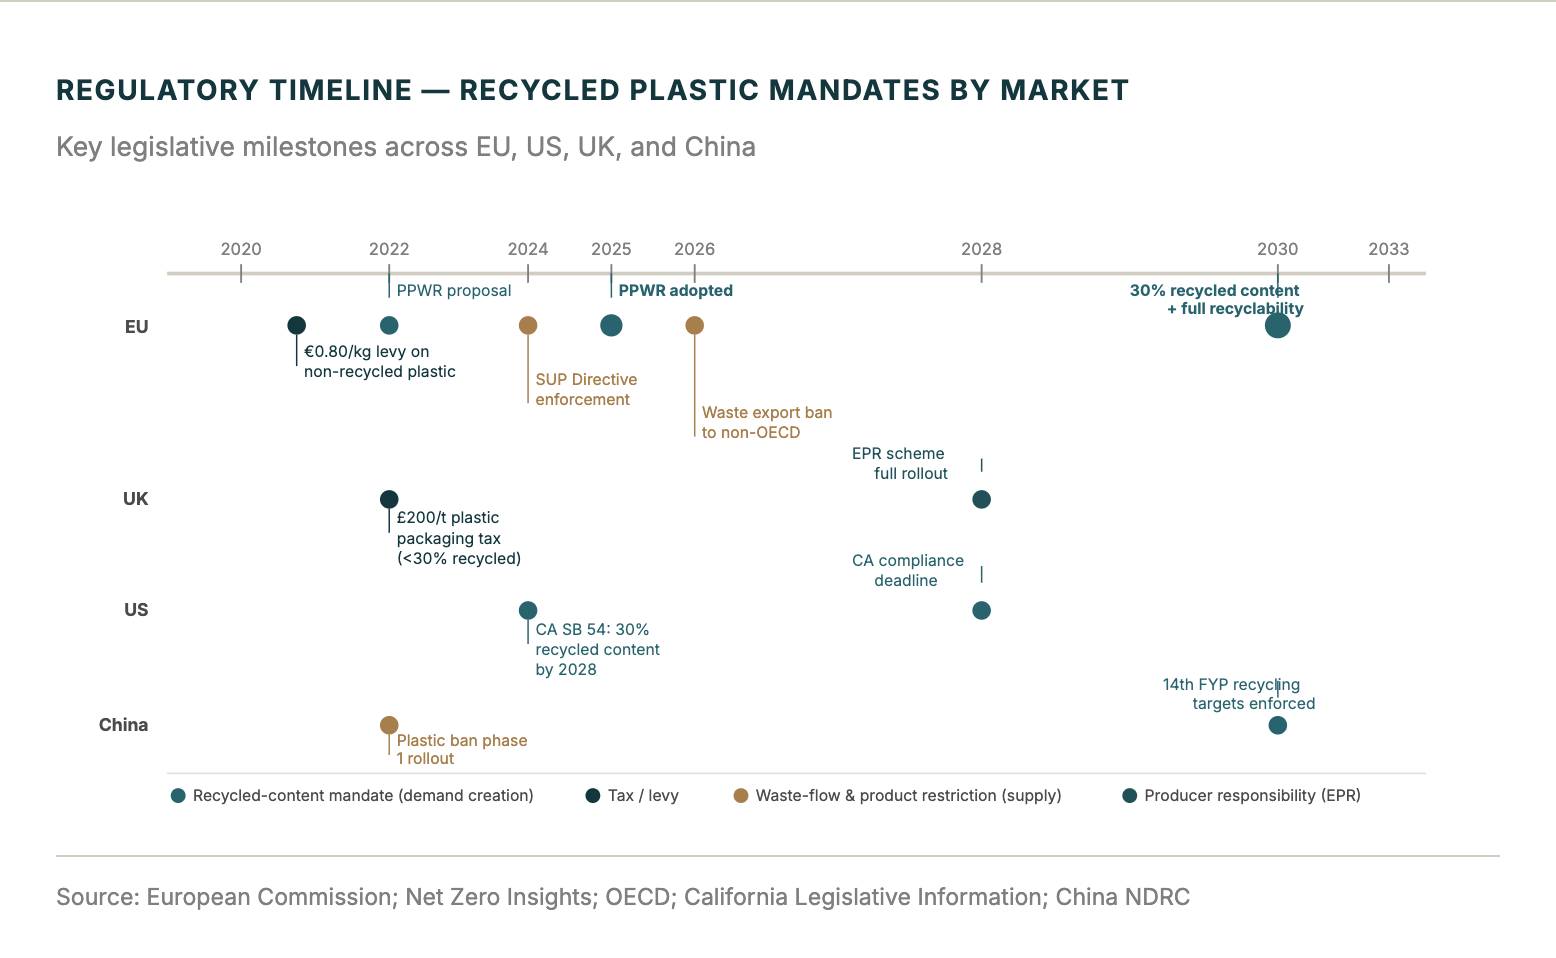
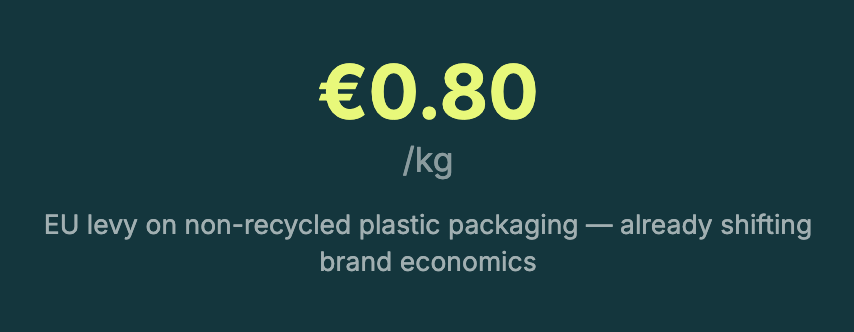
The EU’s Packaging and Packaging Waste Regulation (PPWR) is the most consequential instrument. It sets binding recycled-content targets for 2030, around 30% for most packaging categories, with thresholds varying by application, alongside full recyclability requirements by the same date. [5] A €0.80 per kilogram levy on non-recycled plastic has already shifted packaging economics for large consumer goods companies, and an export ban on plastic waste to non-OECD countries takes effect in November 2026, repatriating volumes that were previously offshored rather than processed domestically. Taken together, these instruments operate through three distinct levers: a tax lever that reshapes economics, a feedstock lock that constrains where volumes can flow, and a licence-to-operate effect that converts recycled content from a sustainability ambition into a compliance requirement.
Corporate commitments amplify the pull. Major fast-moving consumer goods (FMCG) companies, including Unilever, Nestlé, Danone, L’Oréal and peers, have committed to 25–50% recycled content in PET packaging by 2030, against a baseline of 5–15% in 2020: commitments that would require two to three times the recycled PET currently available in Europe. The PET example matters precisely because it is the most mature segment of the recycling market: it offers the clearest, best-documented illustration of a supply imbalance that other, less mature polymer streams are unlikely to escape, even where their dynamics differ materially.
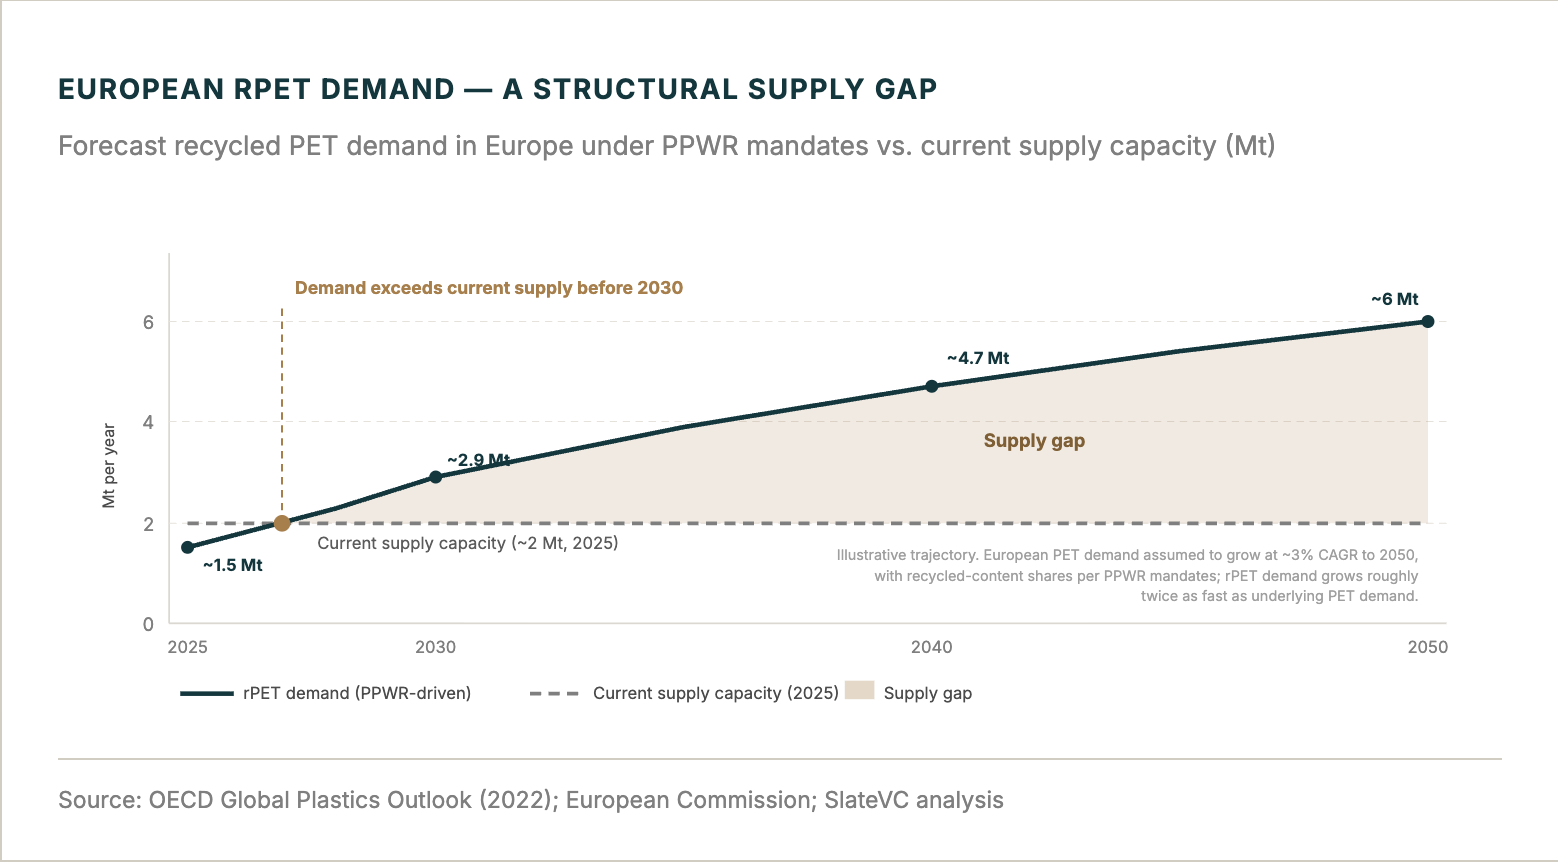
By SlateVC’s analysis, European rPET demand is expected to exceed available supply before 2030 [6], and the gap compounds from there. EU mandates alone could roughly quadruple European rPET demand, from approximately 1.5 million tonnes today to around 6 million tonnes by 2050, with recycled demand growing about twice as fast as underlying PET demand. Virgin plastic, meanwhile, is increasingly penalised through taxes and regulation.
"Demand is visible, policy-backed, and contractually anchored in corporate sustainability commitments. Supply, meanwhile, appears constrained by feedstock availability and processing economics. This structural imbalance may generate a lasting investment opportunity."
This supply-demand imbalance is not a temporary dislocation awaiting correction. It is structurally embedded in the asymmetry between regulatory timelines, which are fixed and accelerating, and the capital cycles of recycling infrastructure, which are long and uncertain.
[.green-box]Section 03[.green-box]
The Value Chain: Understanding Where Bottlenecks Actually Sit
Before evaluating specific technologies, it is essential to read the plastic recycling value chain as a system, because the location of bottlenecks determines where competitive moats form and where investment returns accrue.
The value chain runs from waste collection through sorting, pre-processing, and recycling conversion, to compounding (blending recycled resin with additives), and finally to brand owners and converters. Each step compounds yield losses, contamination risk, cost, and operational complexity. Two questions must then be kept apart, because they have different answers:
- Where is value captured today? Downstream, where brand owners and converters hold most of the price-setting power.
- Where does the system bind? Upstream, in collection and sorting, where the throughput of the entire chain is largely determined.
The distinction matters because the two questions point investors in different directions: the most visible margins and the most binding constraint sit, today, at opposite ends of the chain.
The global picture sets the scale of the failure. Of the 353 million tonnes of plastic waste generated worldwide in 2019, only 9% was recycled. [7] Roughly half went to landfill, a fifth was incinerated, and 22% was mismanaged, openly dumped or leaked into the environment. Only about 15% of waste entered the recycling stream at all, and barely 60% of what entered emerged as recycled output.
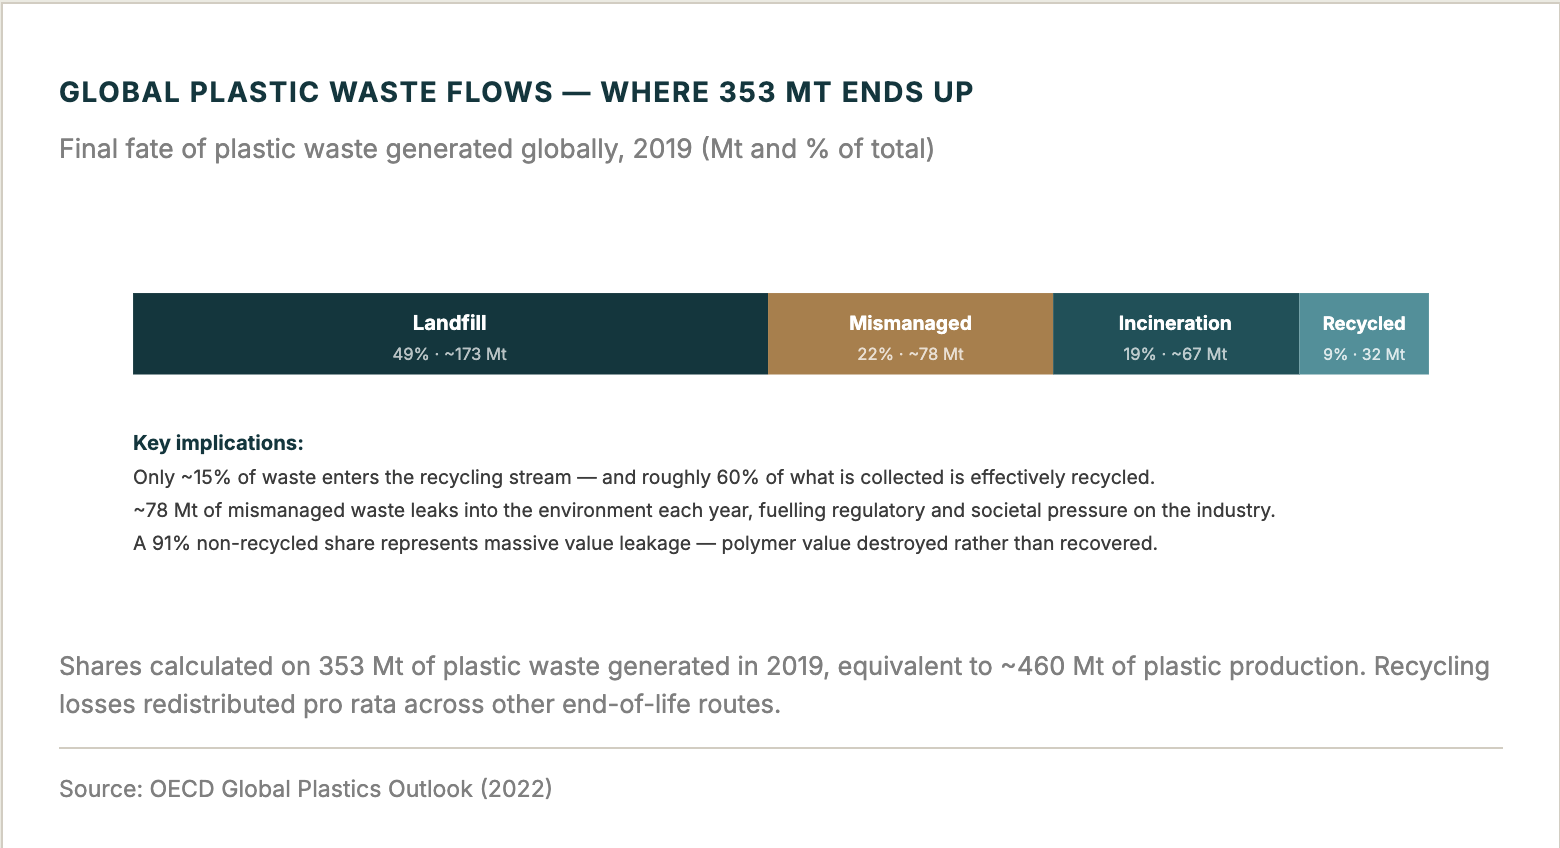
Europe, the most advanced recycling region globally, shows how that leakage happens, step by step.
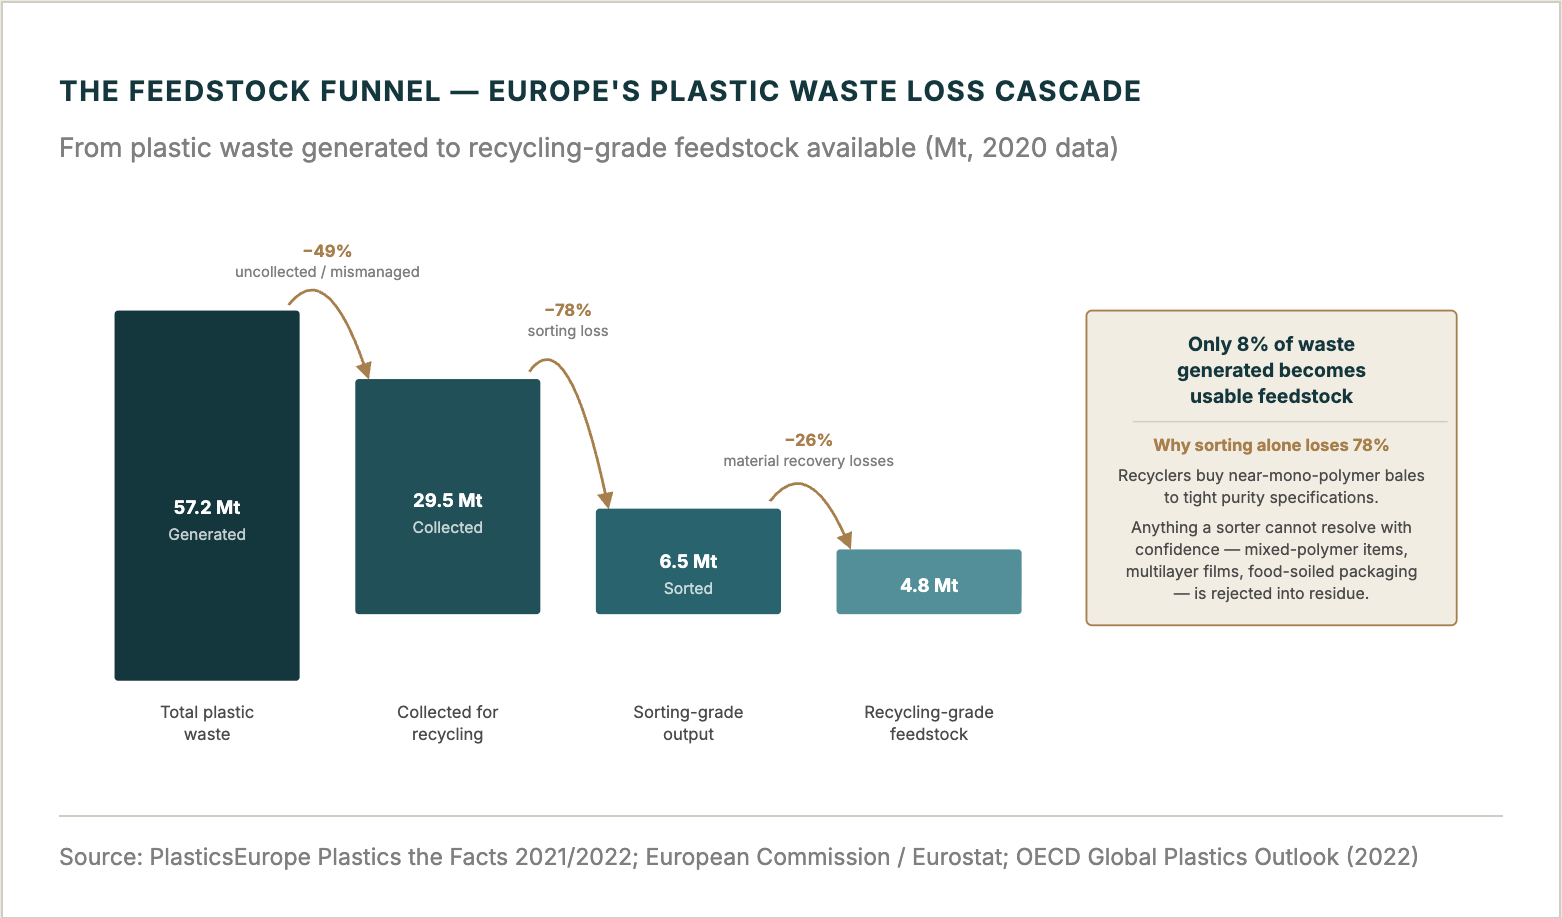
In Europe, approximately 80% of plastic waste is lost before it ever becomes usable recycling feedstock. Of the 29.5 million tonnes of plastic waste collected in 2020, only 6.5 million tonnes were sorted to a standard suitable for recycling. After material recovery losses (food contamination, polymer degradation, incompatible additives, multilayer packaging), just 4.8 million tonnes reached recycling-grade specification. [9] That represents roughly 16% of what entered the collection system, and only 8% of total waste generated.
The sorting step alone accounts for 78% of the loss. [8] The figure appears extreme only until the mechanics are considered: recyclers buy near-mono-polymer bales to tight purity specifications, and a sorting plant rejects into residue every item it cannot resolve with confidence. The causes are structural features of how plastic is produced and consumed, not edge cases to be engineered away. Mixed polymer streams, multilayer packaging that optical sorting cannot separate, food contamination, and labels or adhesives that compromise flake purity are endemic to the waste stream. This is also why recycling performance differs so widely across polymers: today’s infrastructure is optimised for PET, not for the broader waste stream.
"Access to high-quality feedstock is the primary competitive moat in this sector. The question is not which recycling technology you operate — it is whether you control the input it requires."
[.green-box]Section 04[.green-box]
A Taxonomy of Recycling Technologies — and Why No Single Pathway Wins
There is no winner-takes-all technology in plastic recycling. Each pathway addresses a distinct waste stream, produces a distinct output, and carries a distinct cost and risk structure, which is why linear rankings mislead. What unites the investable subset is convergence: feedstock access, technology readiness, and unit economics that can withstand realistic market conditions.
One fact must anchor any honest taxonomy: mechanical recycling processes the overwhelming majority of recycled volumes today and will remain the backbone of the system for years to come, while chemical pathways, for all their promise, remain marginal in volume terms. The question is not whether chemical routes replace mechanical recycling; it is where each pathway earns its place alongside it.
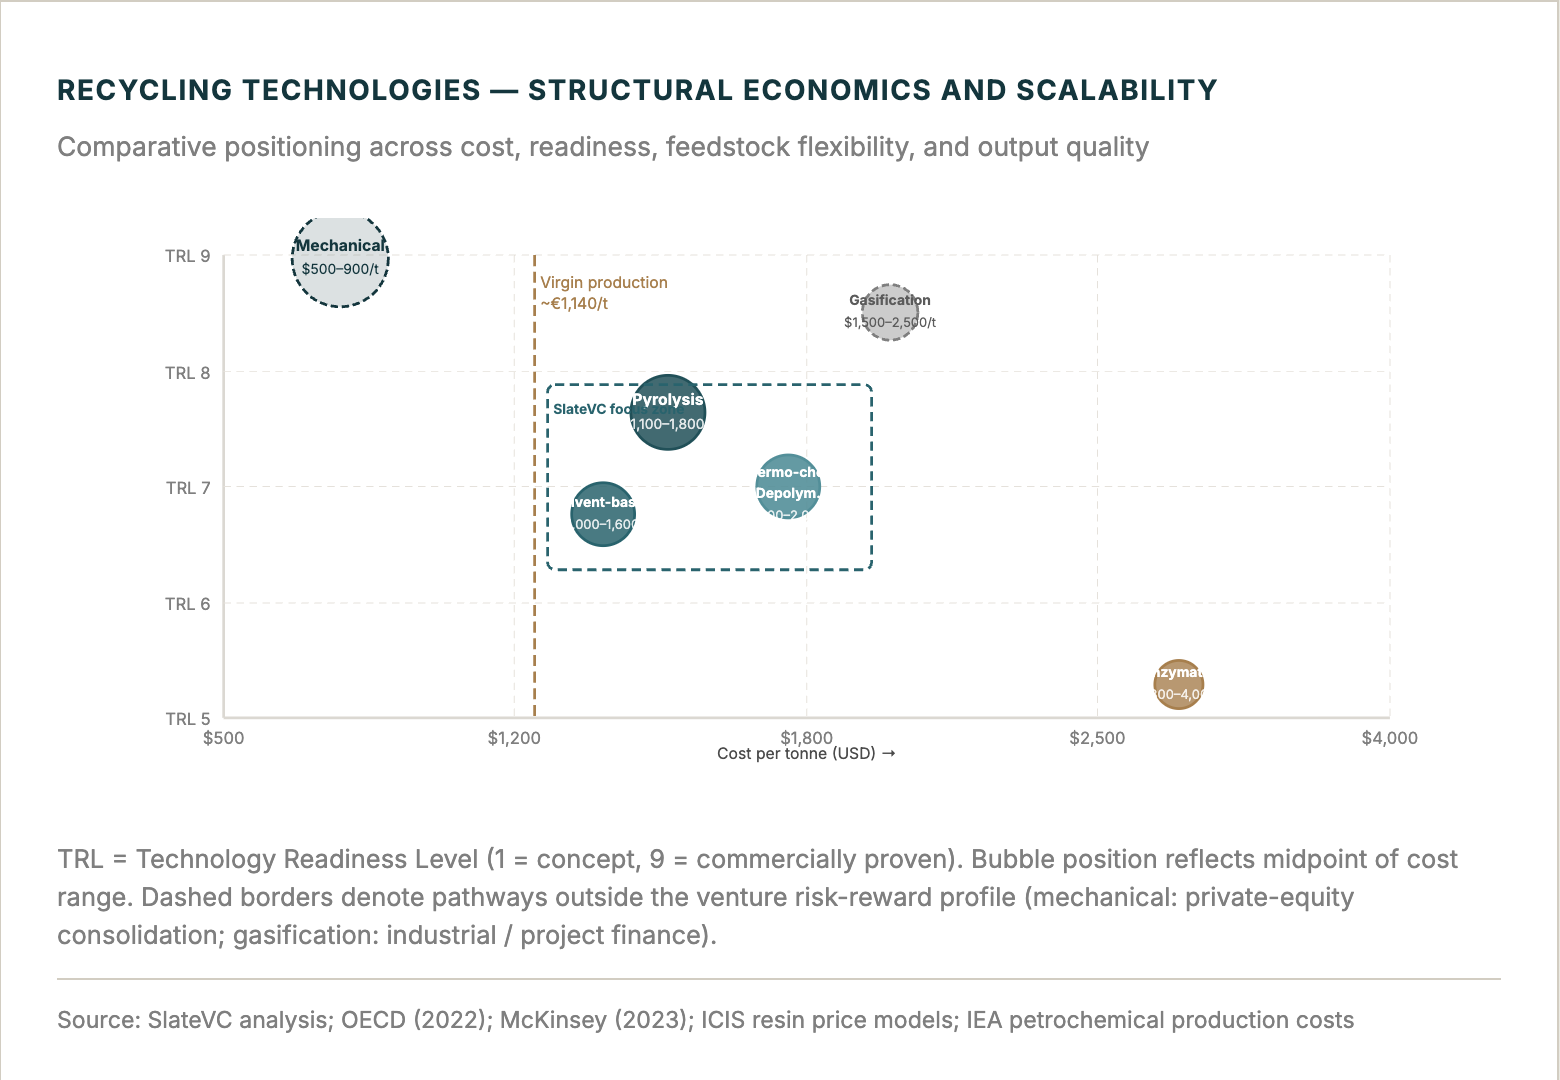
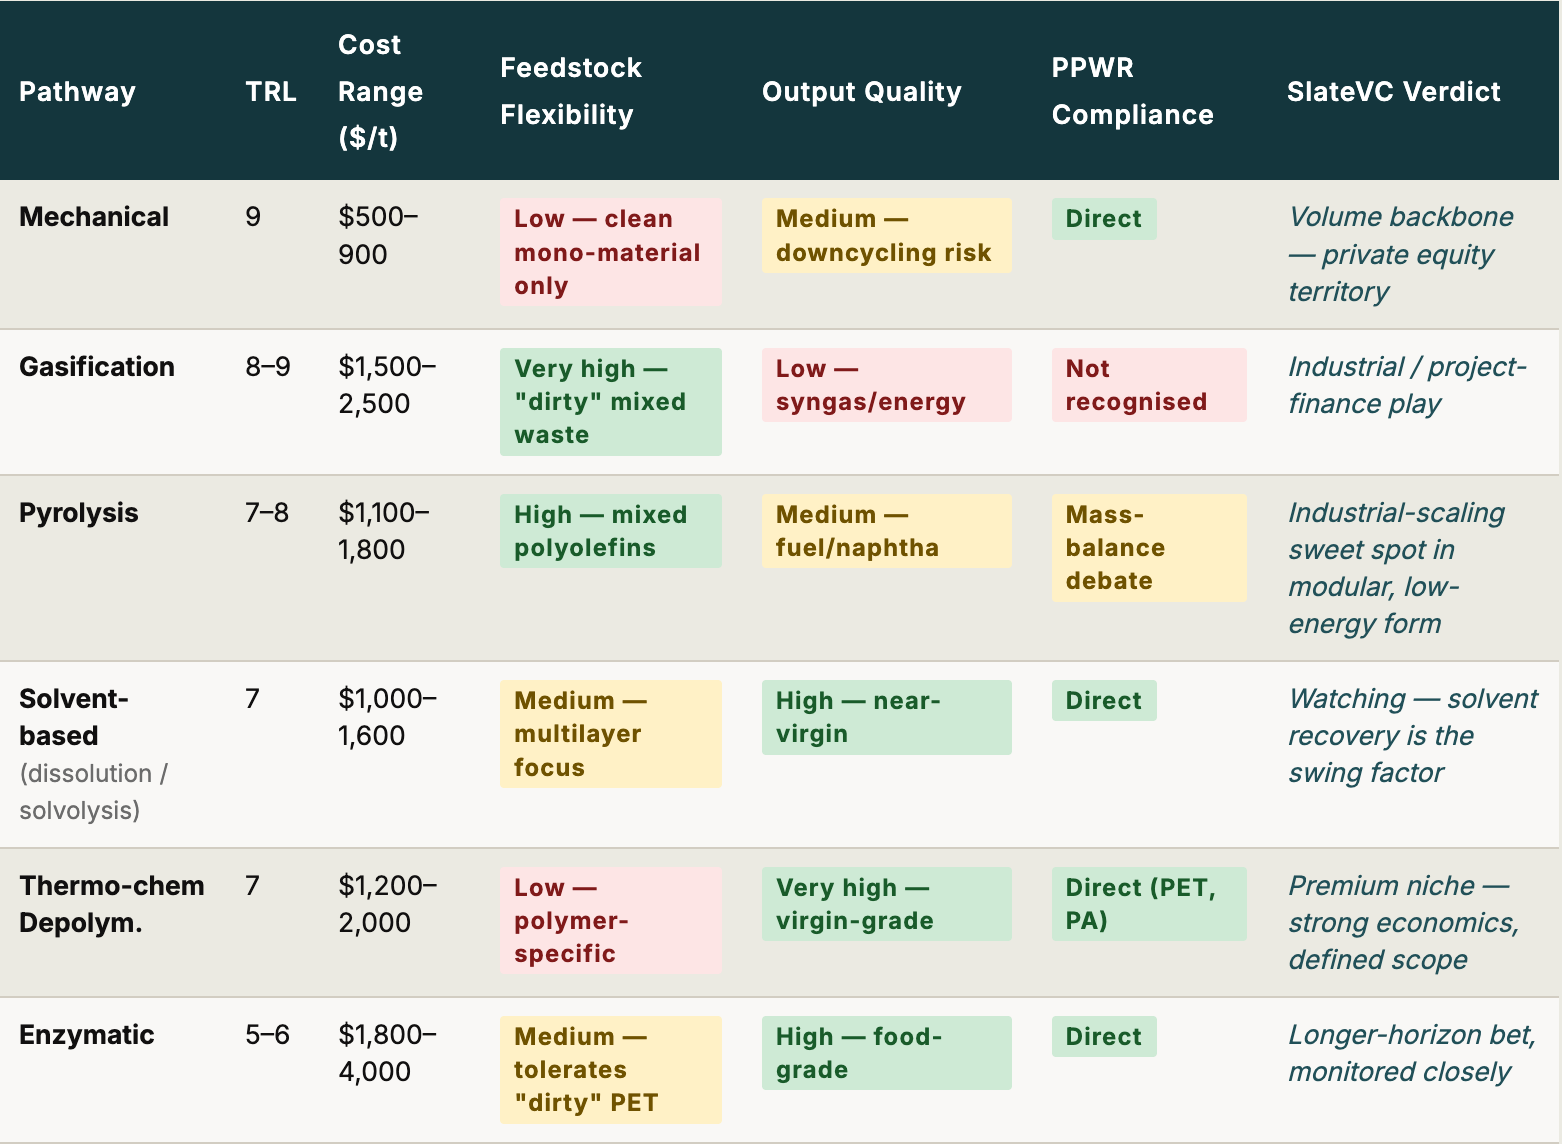
Mechanical recycling is the workhorse and the legacy cash cow of the sector: the lowest-cost pathway at $500–900 per tonne, the most mature (TRL 9), commercially proven, and asset-light relative to alternatives. It processes the overwhelming majority of recycled volumes today, and nothing on the horizon displaces it from that role. Its limitation is one of scope rather than viability: it requires clean, mono-material input streams; each cycle degrades polymer properties, a phenomenon called downcycling, and its outputs rarely qualify for food-contact applications. It cannot, therefore, address the mixed, contaminated, multilayer majority of the waste stream. As an investment, it is consolidation territory for private equity, not because it is unattractive, but because it is mature; the venture-scale growth vectors lie elsewhere.
Pyrolysis converts mixed polyolefin waste thermally, at 400–700°C, into pyrolysis oil, a naphtha substitute that re-enters existing petrochemical infrastructure. Feedstock flexibility is its decisive advantage: it accepts the mixed, low-quality input that mechanical recycling cannot. Costs of $1,100–1,800 per tonne reflect energy intensity and capital requirements, and a regulatory debate persists over whether mass-balance accounting (attributing recycled credits across a mixed feedstock stream) qualifies as genuine material recycling under PPWR. The investable edge is narrowing to modular, lower-energy configurations, where improving unit economics meet the largest addressable waste stream.
Gasification sits at the far end of the thermal spectrum: it converts highly contaminated mixed waste into syngas at very high temperatures, at indicative costs of $1,500–2,500 per tonne. It tolerates feedstock that no other pathway accepts, but it requires refinery-scale capital and full EPC execution, and carries a substantial CO₂ profile. It is best understood as an industrial and project-finance play.
Solvent-based recycling covers two closely related variants: dissolution, which uses solvents to recover the polymer intact, and solvolysis, which uses them to break polymers down into monomers. Both are particularly suited to multilayer packaging and complex textile streams, with near-virgin outputs qualifying for food-contact use. The economics, at $1,000–1,600 per tonne, depend on several variables: input purity, solvent cost and handling, energy for separation. Solvent recovery is the most decisive among them: at recovery rates meaningfully below ~99%, the economics deteriorate rapidly. That dependency is what separates credible operators from the rest.
Thermochemical depolymerisation targets specific polymer families, primarily PET, polyamide, and polyurethane, breaking them into constituent monomers of near-virgin quality. Outputs command premium pricing in food-grade and cosmetics-grade markets, and for PET the pathway is a direct PPWR compliance enabler. Costs of $1,200–2,000 per tonne reflect purification requirements. This is a premium niche: strong economics within a deliberately narrow polymer scope.
Enzymatic recycling operates at low or ambient temperature, delivers excellent yields, and produces food-grade outputs: the most elegant chemistry in the landscape. It is also the most expensive, at $1,800–4,000 per tonne, driven by enzyme production costs and scale constraints. At TRL 5–6, it is best treated today as a longer-horizon opportunity, though the pace of enzyme engineering and early industrial demonstrations warrants close monitoring.
[.green-box]Section 05[.green-box]
Where Structural Value Concentrates — and Why the Upstream Is the Key
Most investor attention in this sector has historically converged on the conversion technologies themselves: pyrolysis plants, depolymerisation reactors, enzymatic processes. That focus, while understandable, risks overlooking a more fundamental constraint. The rate-limiting factor is not conversion. It is feedstock.
Plastic recycling is, at its core, a feedstock-constrained industry. Technology matters, but technology alone settles nothing. A strong process is investable only when it sits within a complete industrial equation: input streams secured at the right quality and cost, output quality demonstrated, unit economics competitive, technical maturity sufficient, and a clear regulatory and commercial route to market. The relevant question is therefore not which conversion chemistry wins in the abstract, but which configurations of the whole system are bankable.
A Framework for Conversion Technologies
Conversion technologies remain investable, selectively, and only where they clear a demanding grid. Rather than expressing a preference for any single pathway, SlateVC evaluates each opportunity against six criteria.
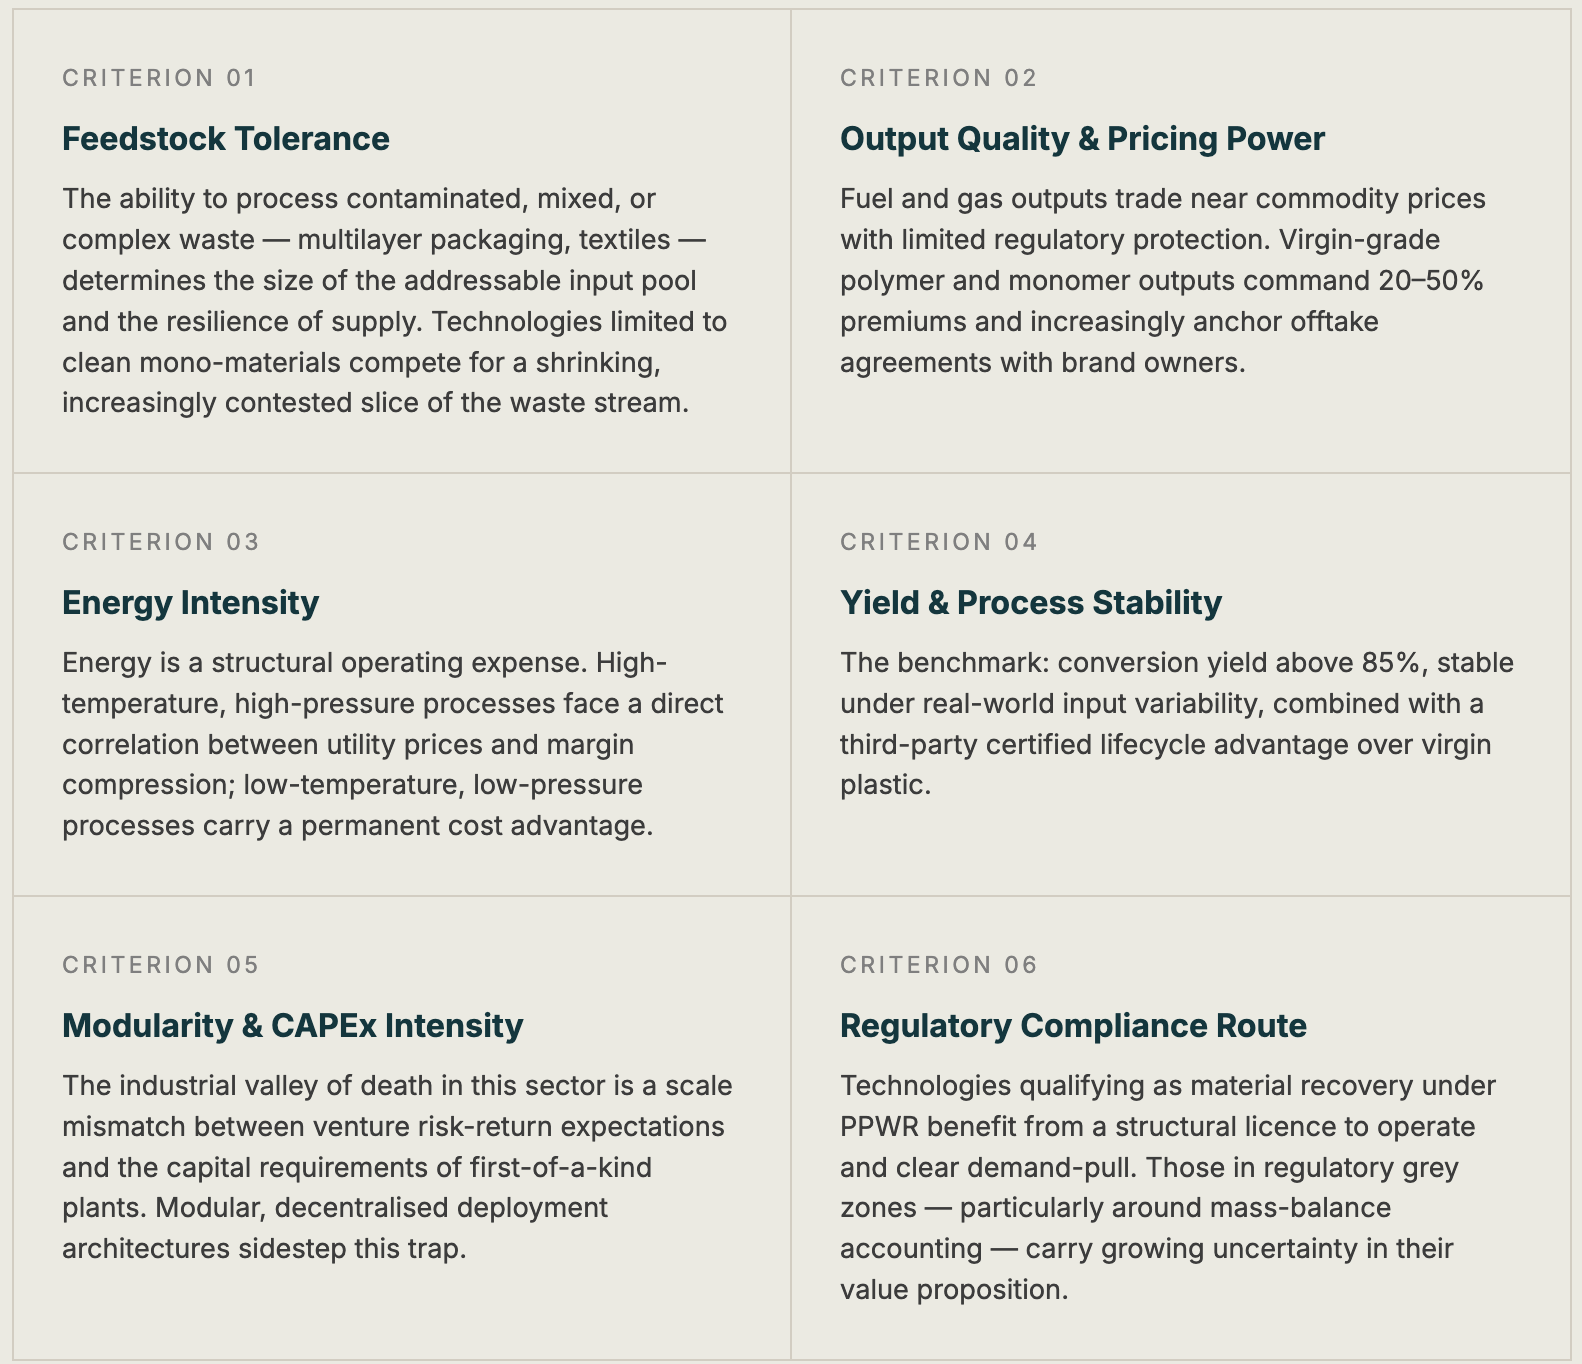
No criterion is decisive in isolation, and the grid is deliberately technology-agnostic. Its purpose is discipline: it filters out configurations where a genuinely strong process sits inside an incomplete industrial equation, and it keeps the analysis honest when enthusiasm for a given chemistry runs ahead of its system economics.
Why Upstream Infrastructure Matters Most
It follows that the most durable opportunities are those that increase the availability of usable feedstock, improve its quality, or reduce how much of it downstream processes require.
SlateVC’s thesis follows from a single observation: the structural bottlenecks sit upstream, and structural advantage increasingly accrues there, while much of the sector’s capital and attention has historically focused on downstream conversion. The collecting and sorting layer, software platforms, sensor-based sorting systems, AI-driven classification, and traceability infrastructure, is therefore a critical investable layer.
The logic is mechanical. Every improvement in collection, sorting, or stream quality improves the economics of every recycler downstream, whatever its chemistry. The businesses occupying this layer can be more asset-light than conversion plants; they can carry recurring revenues through multi-year service contracts, integration into extended producer responsibility (EPR) and deposit return systems, and traceability standards, and they build defensible positions once embedded in national or regional waste infrastructure. This is where some of the most attractive risk-adjusted opportunities are likely to emerge.
"In plastic recycling, the scarce asset is not the reactor. It is access to reliable, specification-grade feedstock."
The plastic recycling sector is at an inflection point, but not one at which all investment is equally attractive. The regulatory and demand architecture has matured enough to de-risk a narrow subset of the landscape, while clarifying that the broader landscape remains structurally challenged. Cost parity with virgin production, approximately €1,140 per tonne on average over 2020–2025, remains out of reach for most chemical recycling routes at current scale and energy costs. Carbon pricing narrows the gap; it does not close it. Premium market access closes it more reliably, which is why output quality and regulatory alignment are among the most durable sources of competitive advantage in this sector.
Competition for usable inputs is intensifying. Regulation is embedding recycled content into the operating requirements of entire industries. The next wave of value creation will not be defined by technology alone, but by the ability to secure, upgrade, and route the right waste streams to the right processes. Plastic recycling is not primarily a technology race: it is a feedstock-constrained infrastructure problem, and the strongest opportunities sit where technology, feedstock control, and unit economics reinforce each other.
Authors
Clément Buyse, General Partner
Sébastien Léger, General Partner
Paul Pihouée, Associate
Notes
- Production volume for 2025; includes all thermoplastics and thermosets, excludes fibres. No single consistent global dataset exists post-2019, and estimates are triangulated across sources. Historical data from OECD, Global Plastics Outlook (2022) and IEA, The Future of Petrochemicals (2018); 2024–2025 estimates based on Plastics Europe, Plastics – the Facts (2024) and industry reports; forecasts based on IEA scenarios.
- Market value covers polymer production and excludes downstream finished goods; it reflects volume growth, product mix, and oil-linked pricing dynamics. World Bank; UNCTAD Trade & Development data; OECD, Global Plastics Outlook (2022); IEA, The Future of Petrochemicals (2018); 2024–2025 estimates triangulated from Plastics Europe (2024) and industry reports.
- 2019 reference year, equivalent to roughly 3.4% of global anthropogenic greenhouse-gas emissions. IPCC, Sixth Assessment Report (2019 global emissions reference); OECD, Global Plastics Outlook (2022); IEA, The Future of Petrochemicals (2018). The aviation comparison refers to ~0.9 Gt CO₂e of direct aviation emissions (IPCC, 2019).
- Lifecycle breakdown based on OECD, Global Plastics Outlook (2022): approximately 60% fossil feedstock and steam cracking, 30% polymerisation and conversion, and 10% end-of-life (~0.1 Gt incineration, ~0.06 Gt recycling, ~0.03 Gt landfilling; methane leakage is generally excluded from OECD estimates).
- Regulation (EU) 2025/40 on packaging and packaging waste (PPWR). Recycled-content targets for 2030 vary by packaging category and polymer; approximately 30% applies to most categories. European Commission; Net Zero Insights; OECD.
- Illustrative SlateVC projection based on OECD, Global Plastics Outlook (2022); European Commission (PPWR recycled-content schedules); IEA, The Future of Petrochemicals (2018). Assumes European PET demand grows at ~3% CAGR to 2050, with recycled-content shares per PPWR mandates; rPET demand grows roughly twice as fast as underlying PET demand.
- Of 353 Mt of plastic waste generated globally in 2019: 32 Mt (9%) recycled, ~49% landfilled, ~19% incinerated, ~22% mismanaged. OECD, Global Plastics Outlook (2022). Recycling losses are redistributed pro rata across landfill, incineration, and mismanaged waste to match OECD 2019 end-of-life shares.
- Calculated on the 2020 European plastics waste stream: of 29.5 Mt collected for recycling, 6.5 Mt was sorted to recycling-grade standard, a sorting rate of ~22%. Losses reflect mixed polymers, multilayer packaging, optical sorting limitations, and contamination (food, labels, paper, metals). Plastics Europe, Plastics – the Facts 2021/2022; European Commission waste statistics (Eurostat); OECD, Global Plastics Outlook (2022); SlateVC analysis.
- Sorted streams meeting purity requirements for use as recycling-plant feedstock, after material recovery losses of ~26% (purification washing, flake production, melt filtration, and process yield losses), equivalent to ~16% of collected waste and ~8% of waste generated. Same sources as note 8.
Principal Sources
The analysis in this article draws principally on the following sources: OECD, Global Plastics Outlook (2022); IEA, The Future of Petrochemicals (2018); Plastics Europe, Plastics – the Facts (2021/2022 and 2024 editions); IPCC, Sixth Assessment Report; European Commission and Eurostat waste statistics, together with Regulation (EU) 2025/40 (PPWR); Ellen MacArthur Foundation, Global Commitment reports; World Bank and UNCTAD trade data; McKinsey, Recycling Plastics: The Next Wave (2023); ICIS resin price models; and SlateVC proprietary analysis, informed by more than 30 interviews with companies and industry experts across the value chain.
Disclaimer. This article reflects SlateVC's internal perspective as of June 2026, grounded in desk research, ecosystem mapping, and direct engagement with companies across the plastic recycling value chain. It does not constitute investment advice. The data and classifications presented are illustrative and reflect a point-in-time view. They do not constitute a final investment strategy or a commitment to specific sub-segments. Past performance is not indicative of future results.
SlateVC — 5 Avenue de l'Opéra, 75001 Paris, France · slate.vc